Y′platform. Smarter Inventory, Powered by AI.
YDISTRI is a SaaS platform that transforms retail inventory through second allocation—reducing deadstock, boosting margins, and unlocking hidden sales opportunities.
Y′platform Benefits
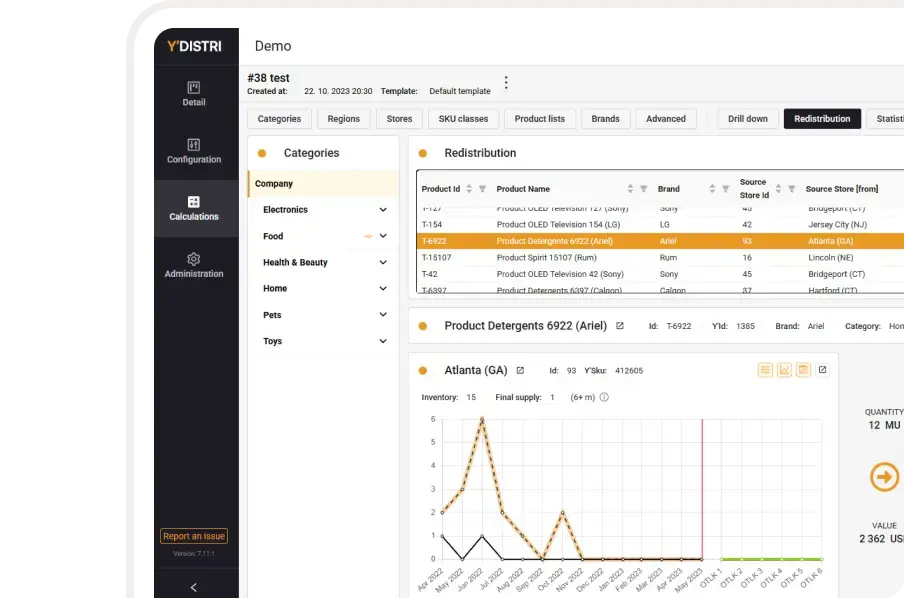
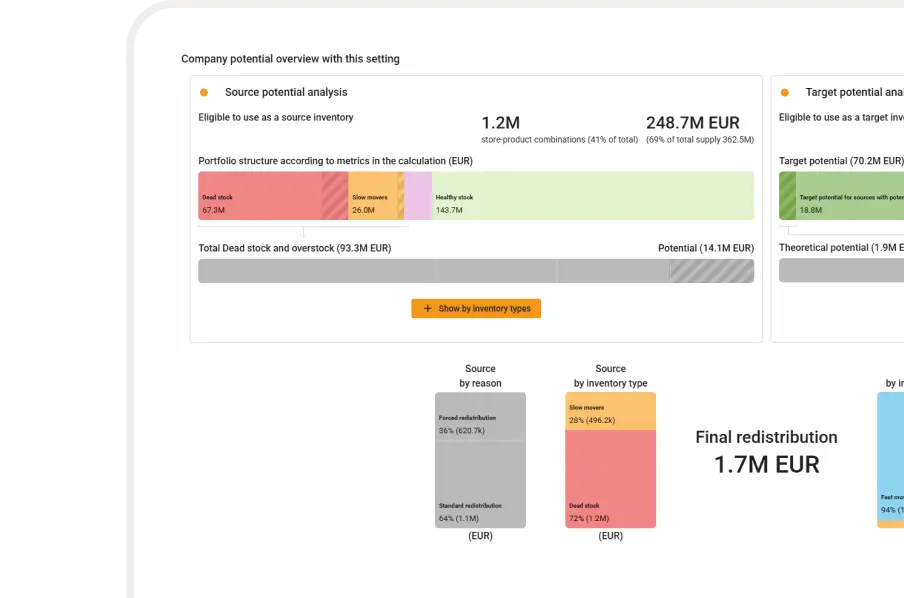
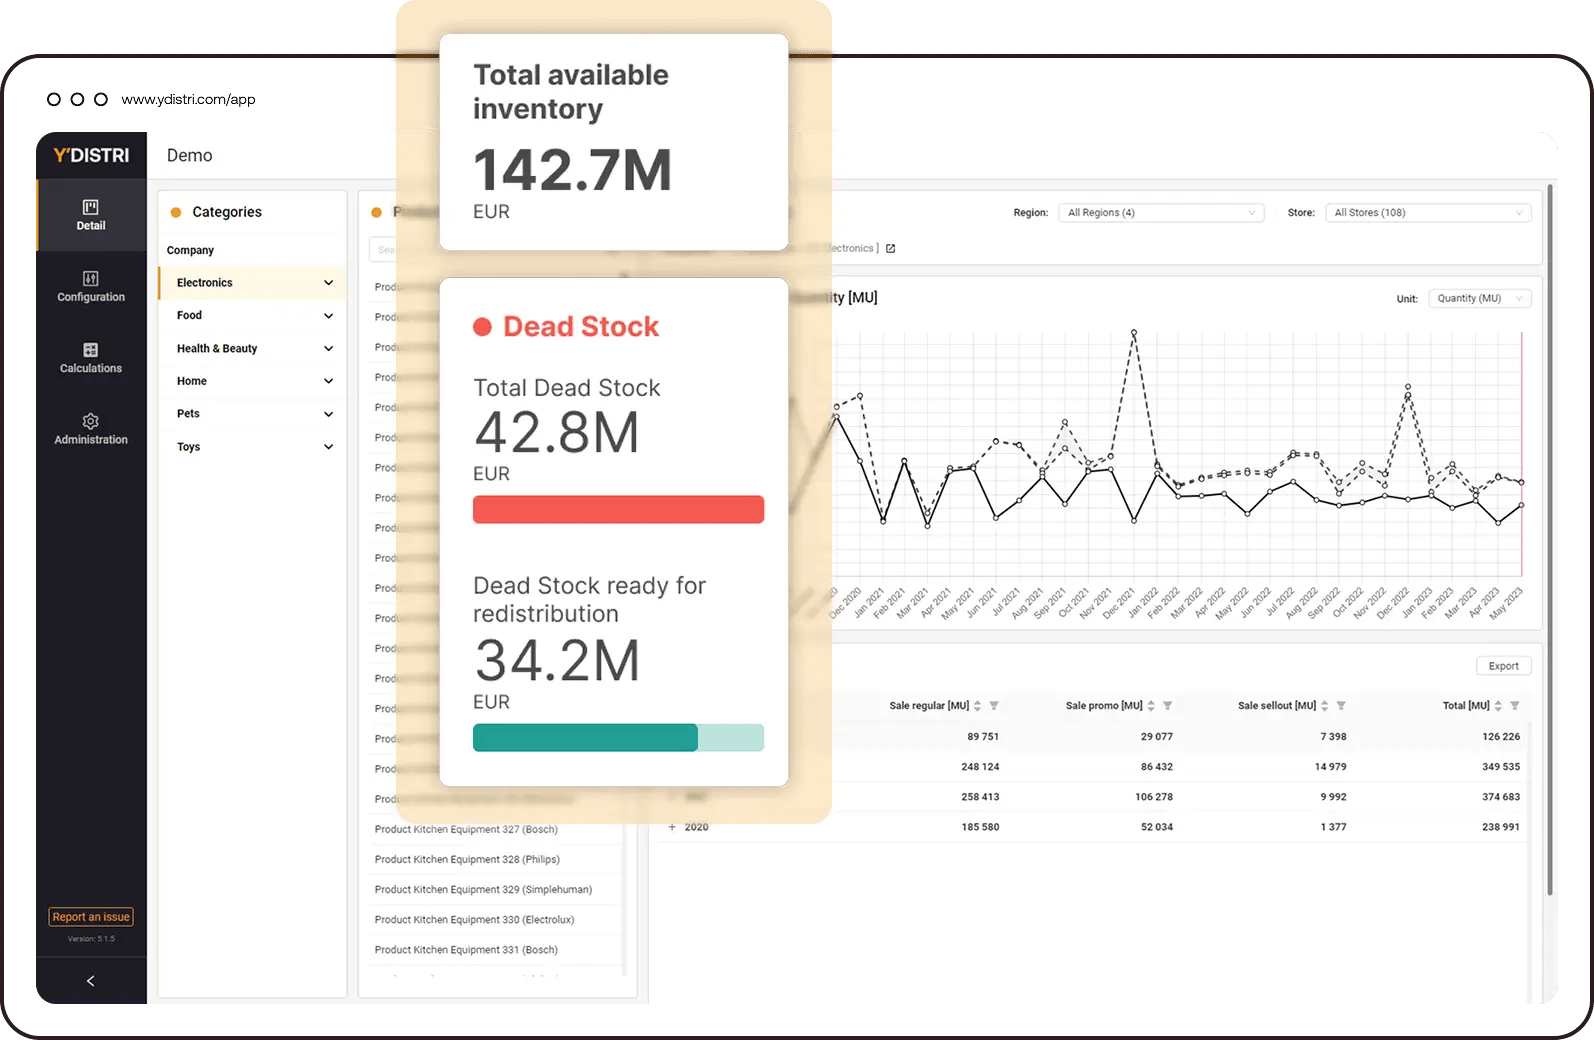
Our intelligent algorithms automatically compute appropriate redistributions to new locations where the probability of selling is high.
Doing so, problematic inventory - underperforming retail stock turns into immediate cash without the need for discounting or even write-offs.
Y′platform Features
We tailor our solution to your specific business needs and can provide rapid implementation in couple of months. YDISTRI is a Microsoft Azure-based SaaS platform that can be seamlessly incorporated into any ERP system, avoiding tedious integrations.
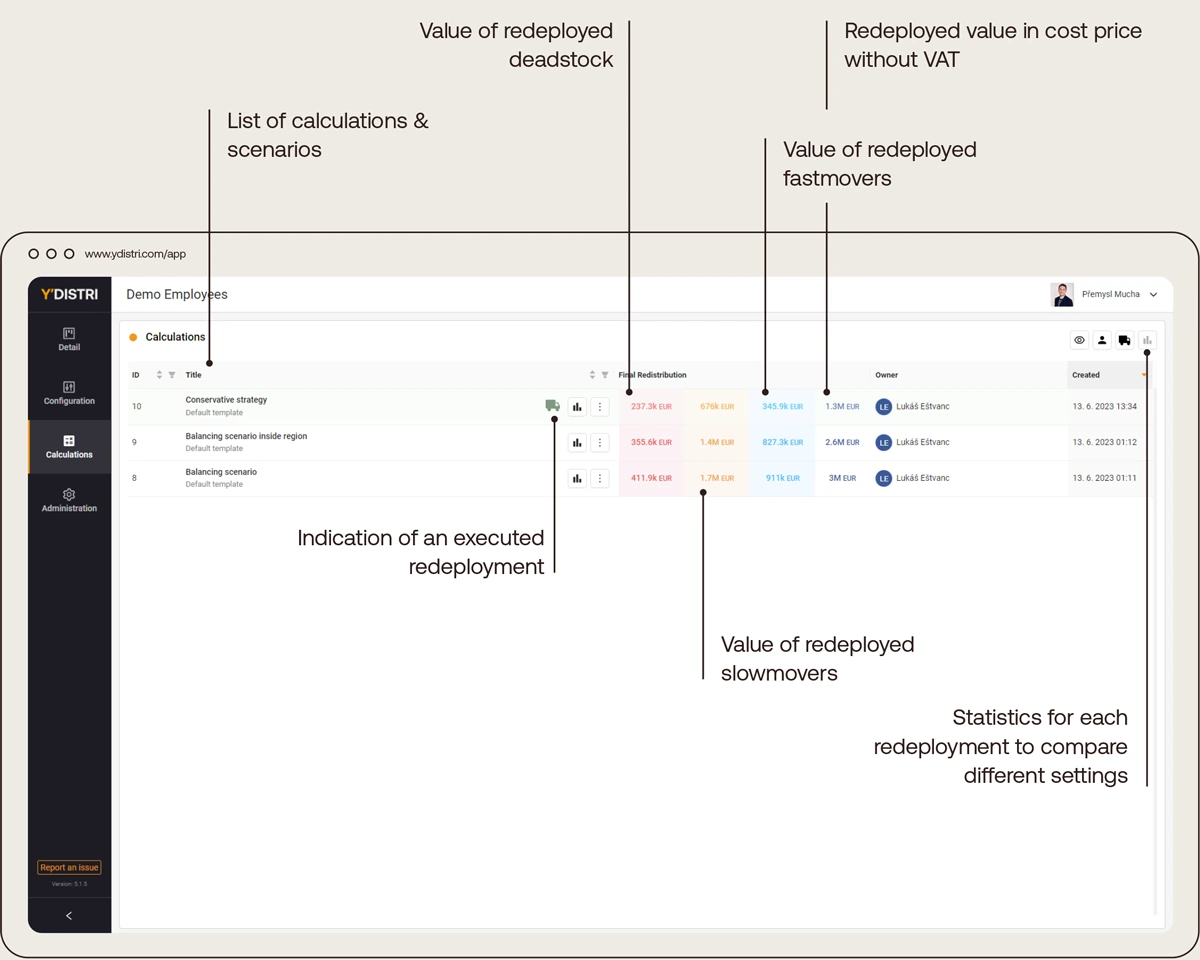
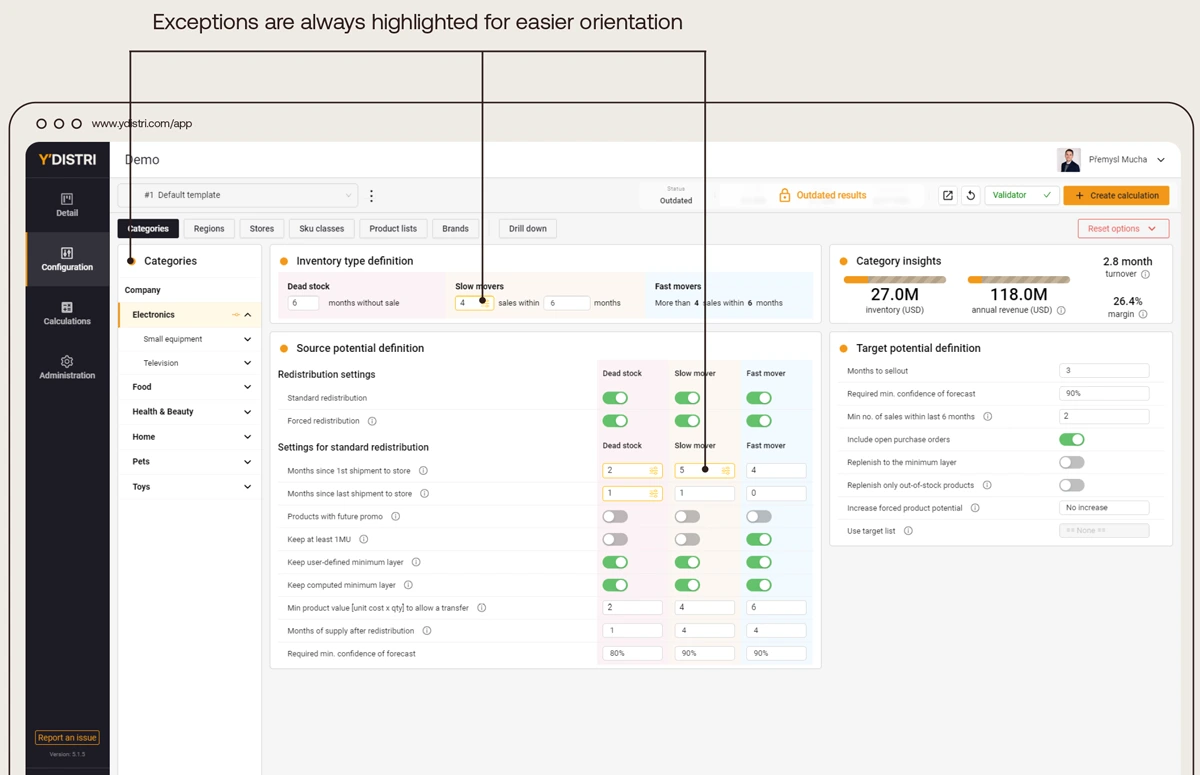
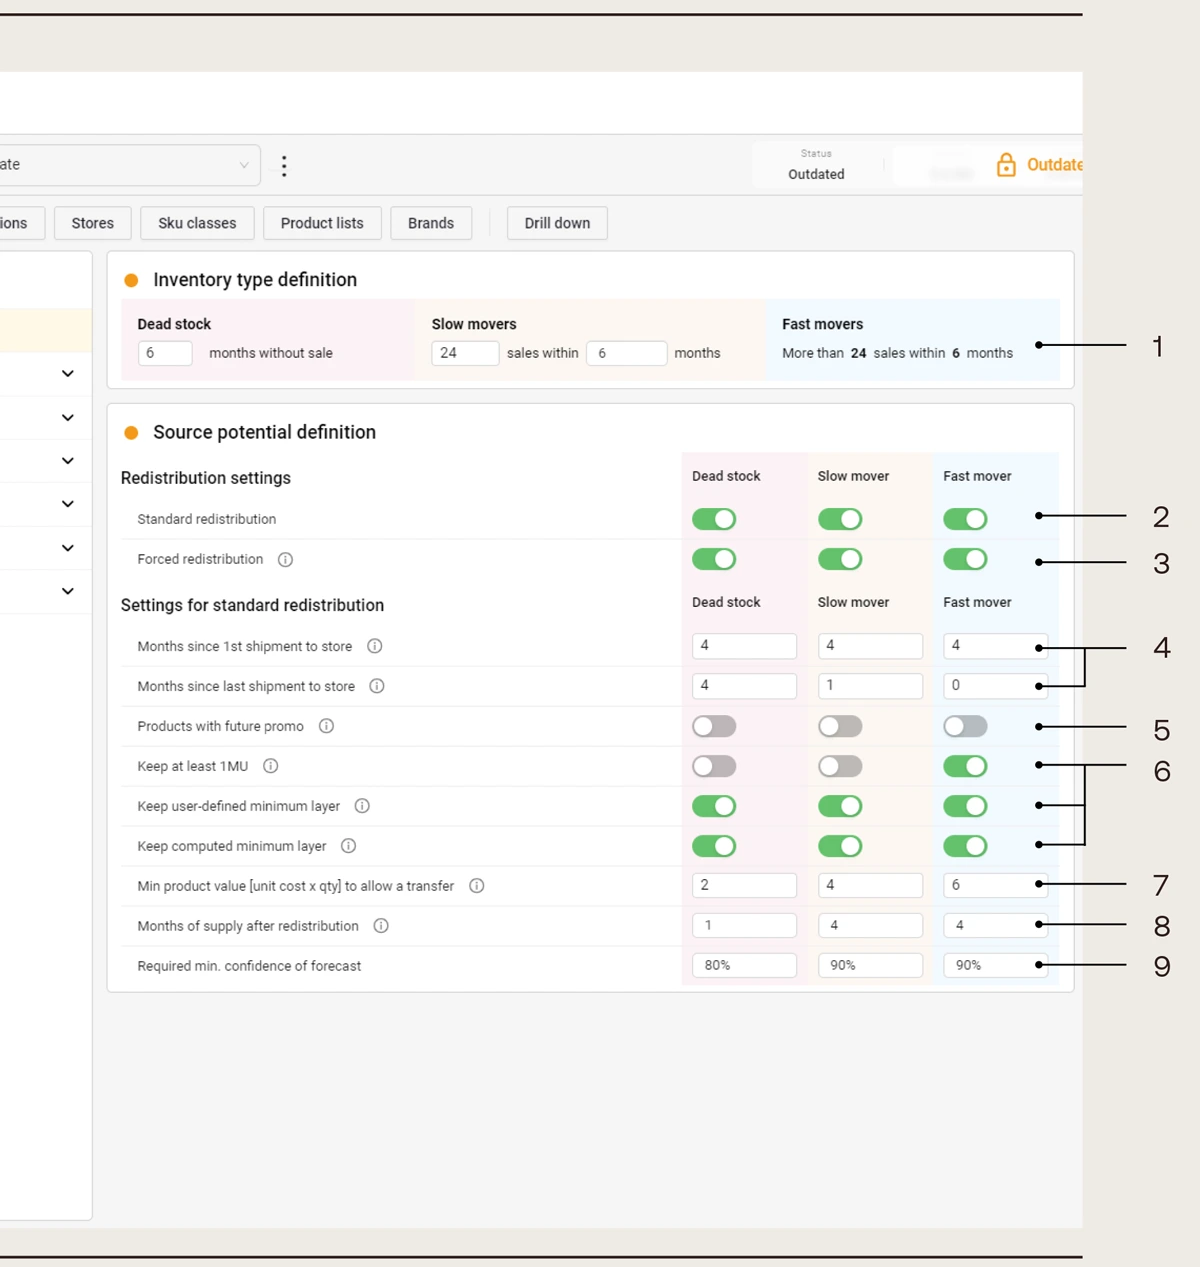
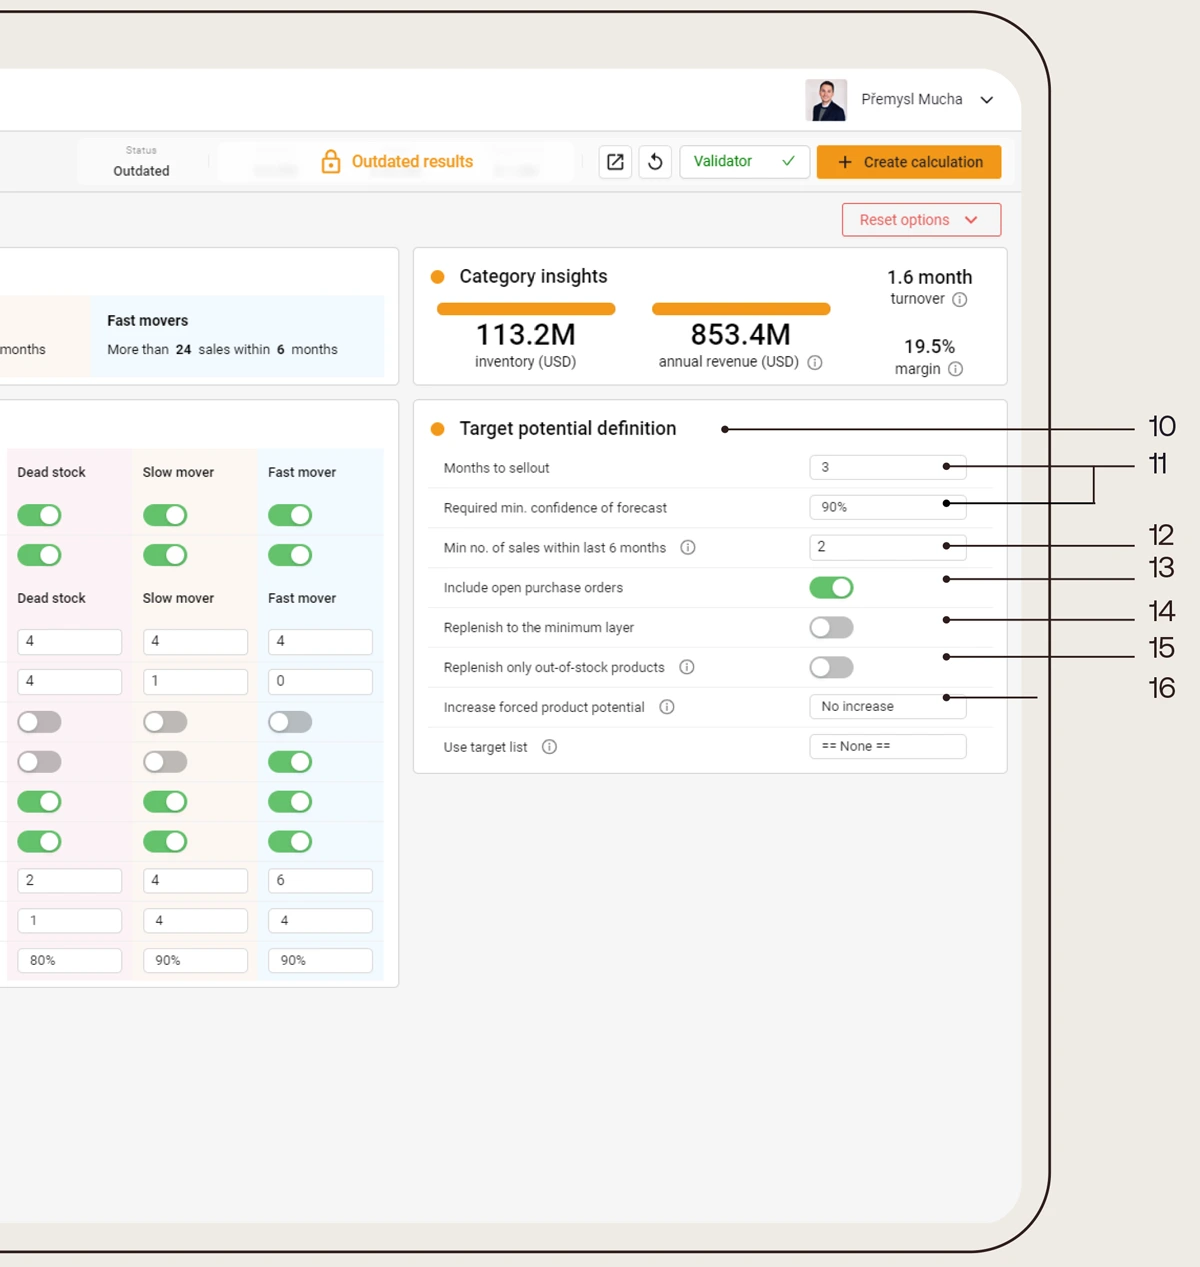
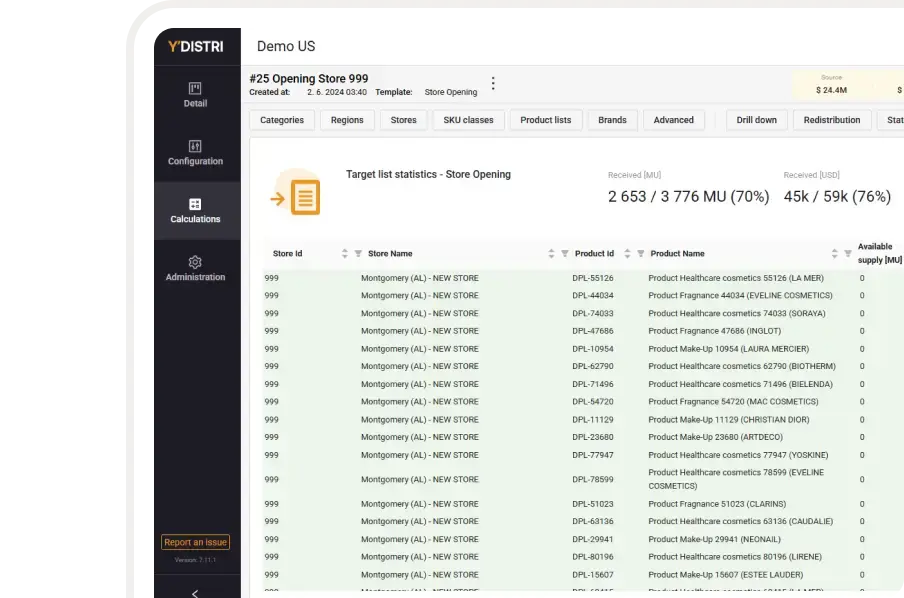
A few clicks to result
Quick & visual guidance from the initial settings to the desired results.
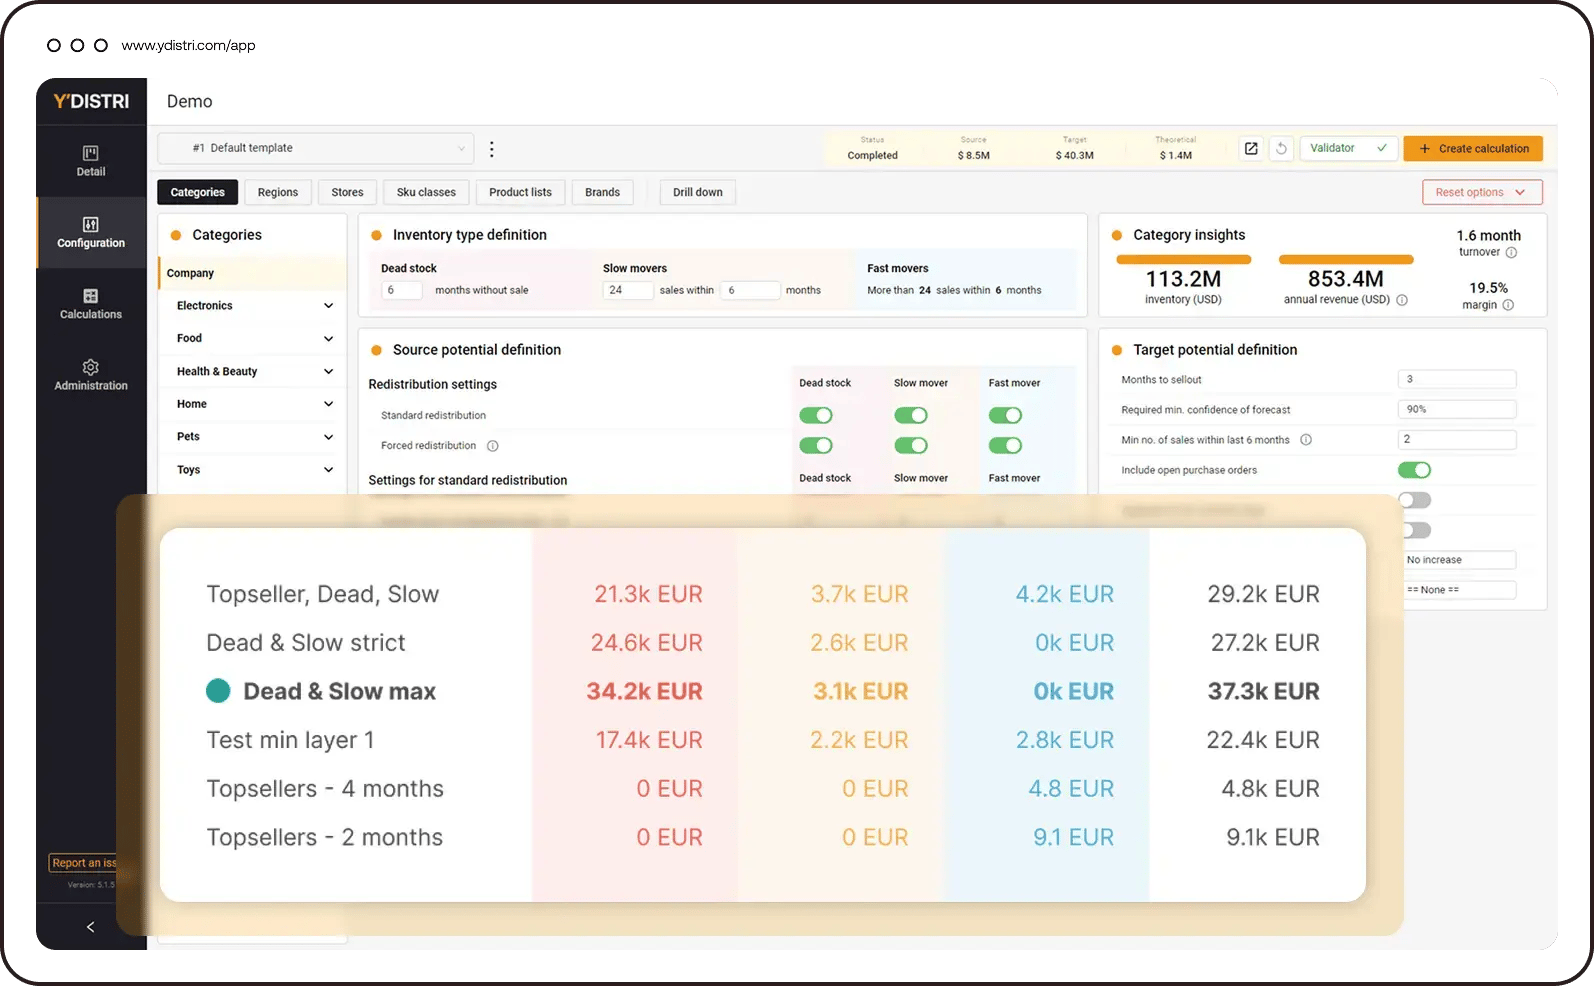
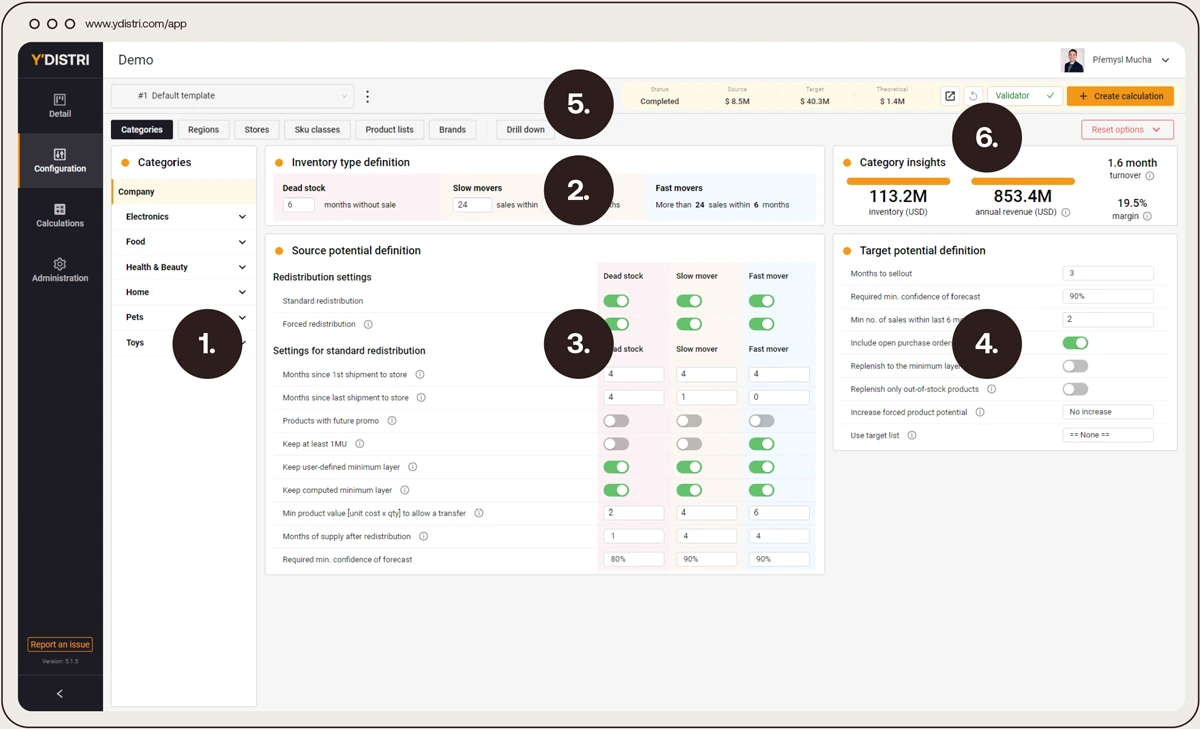
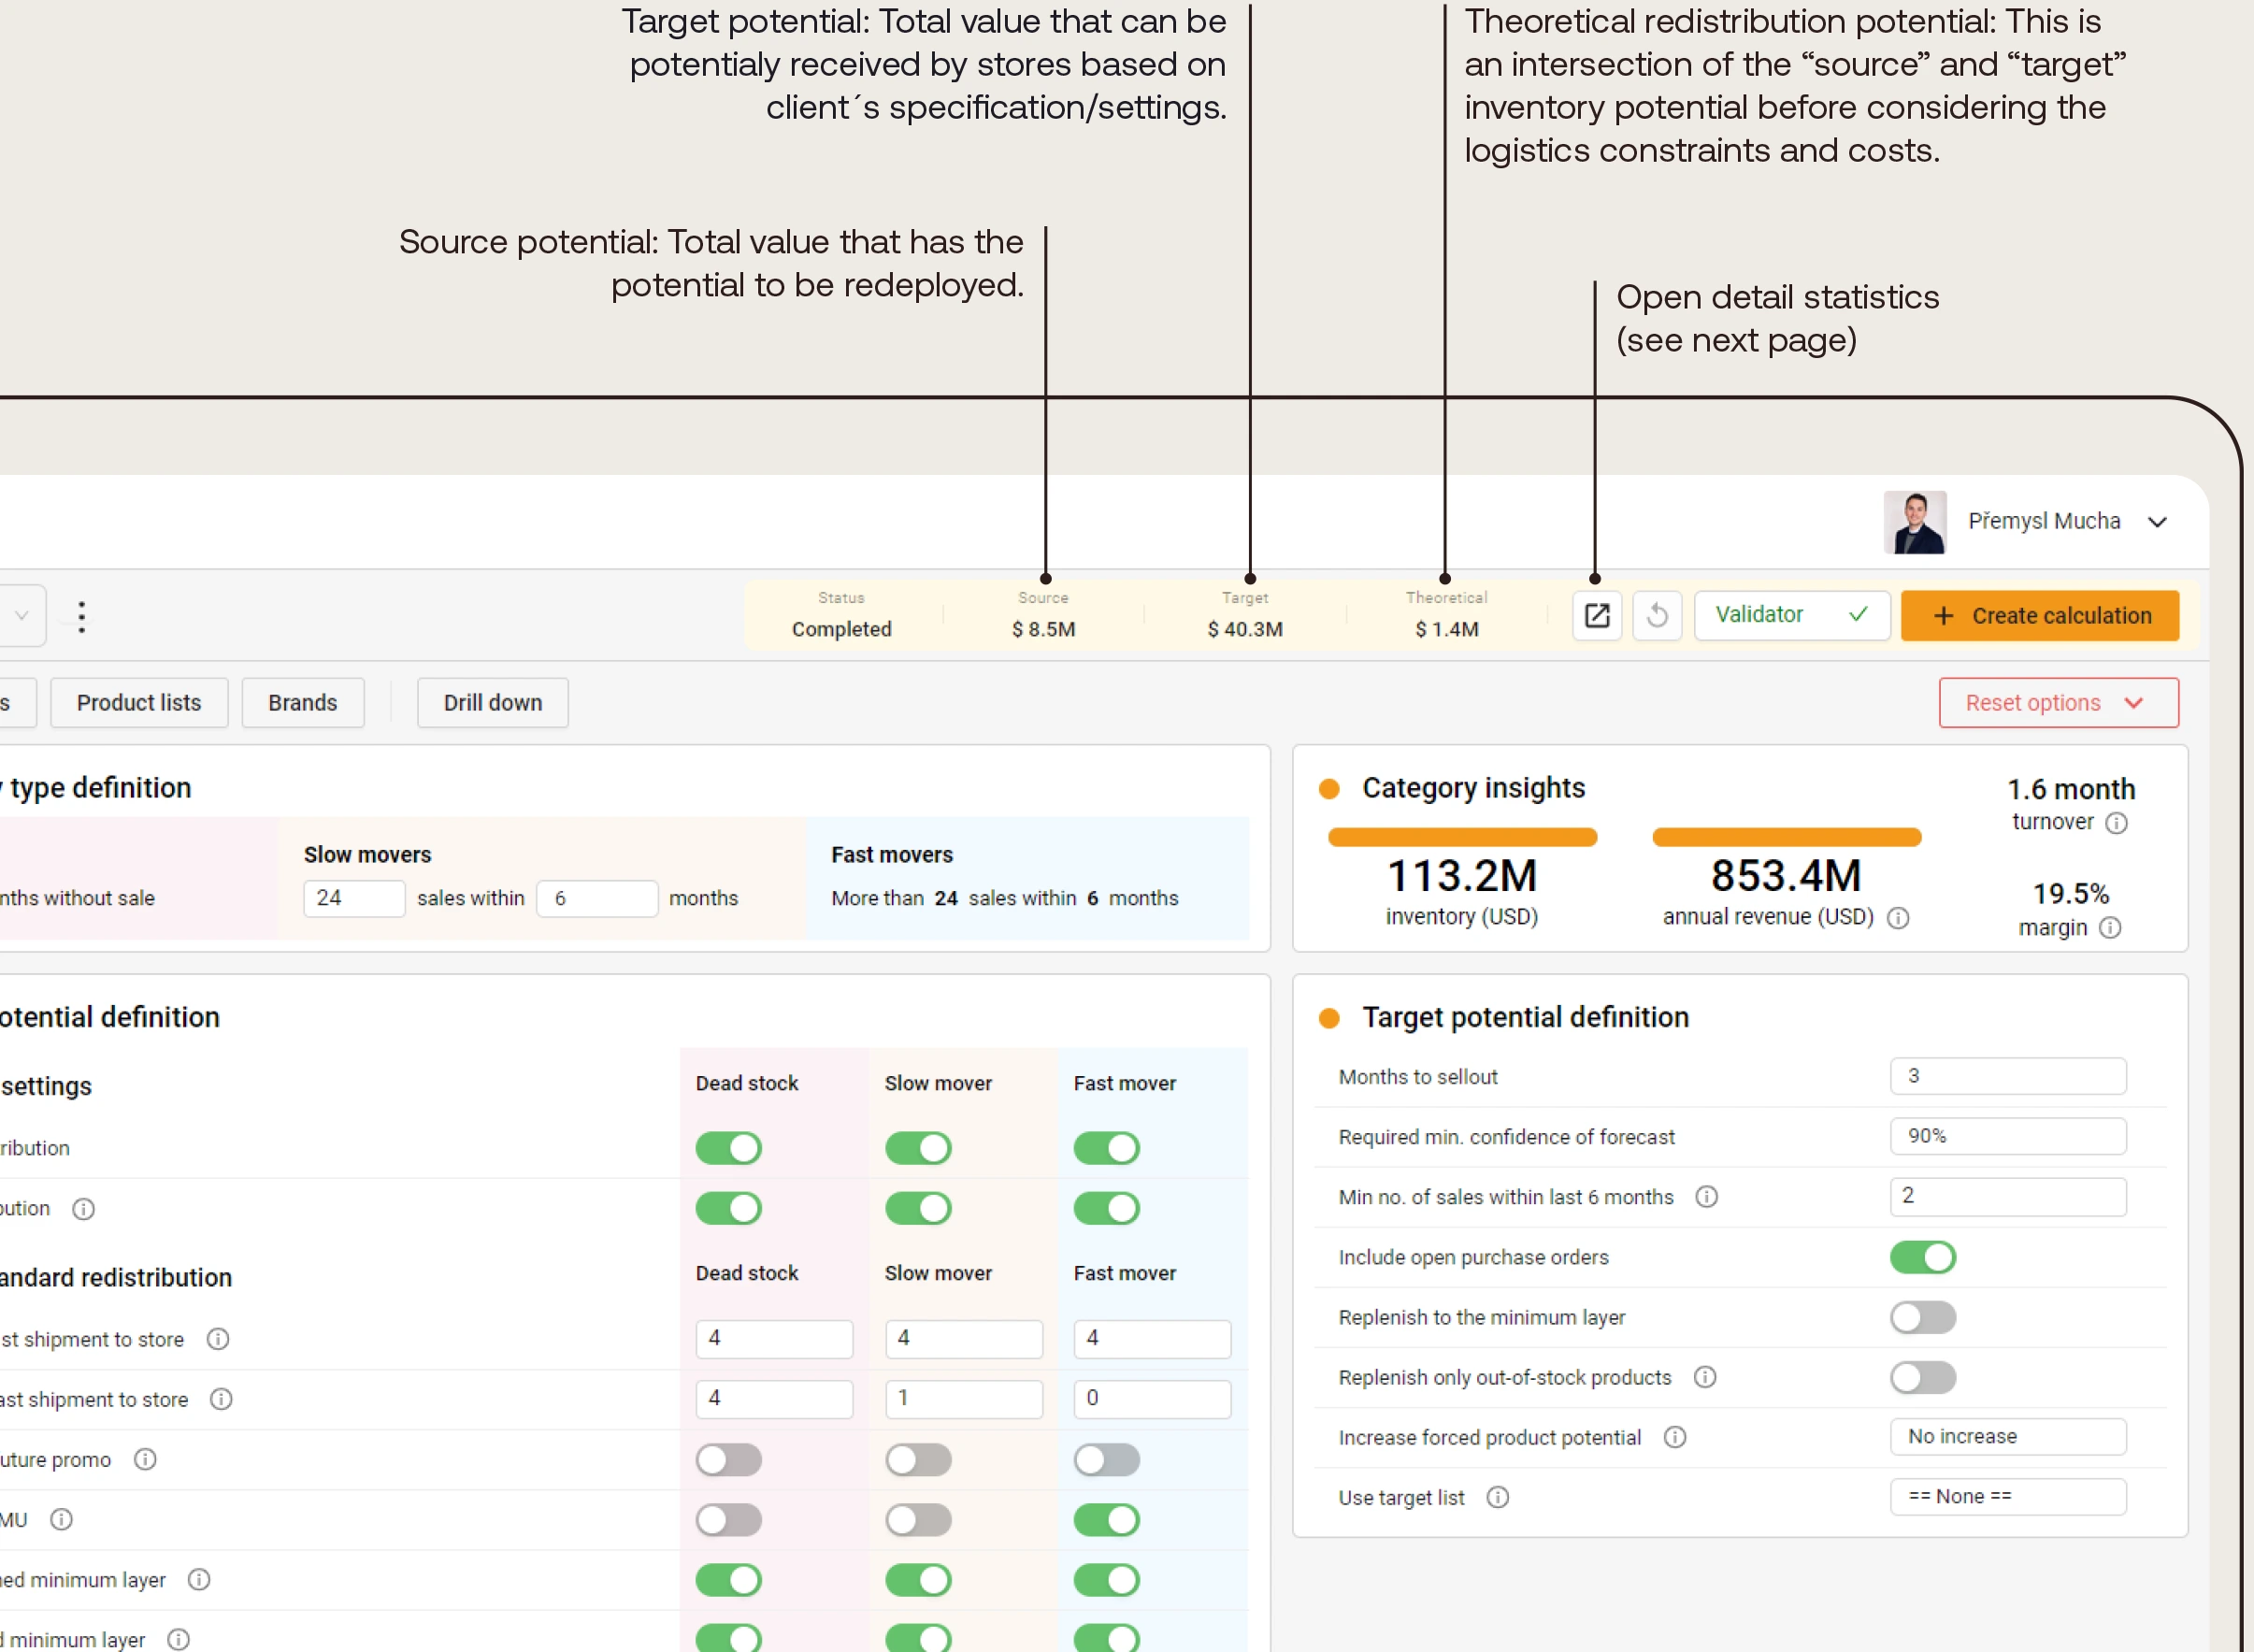
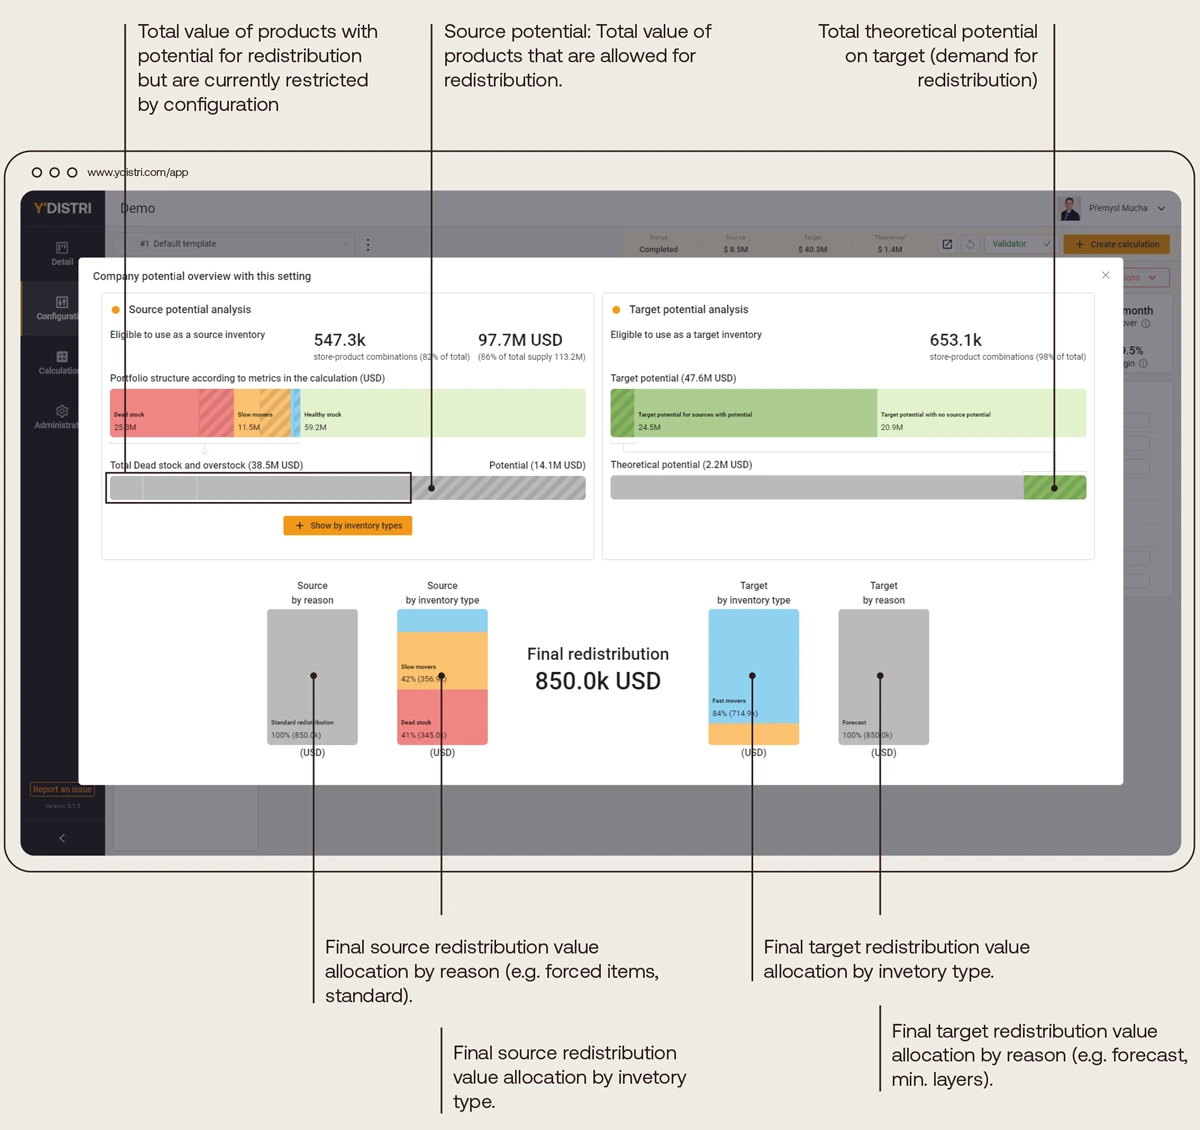
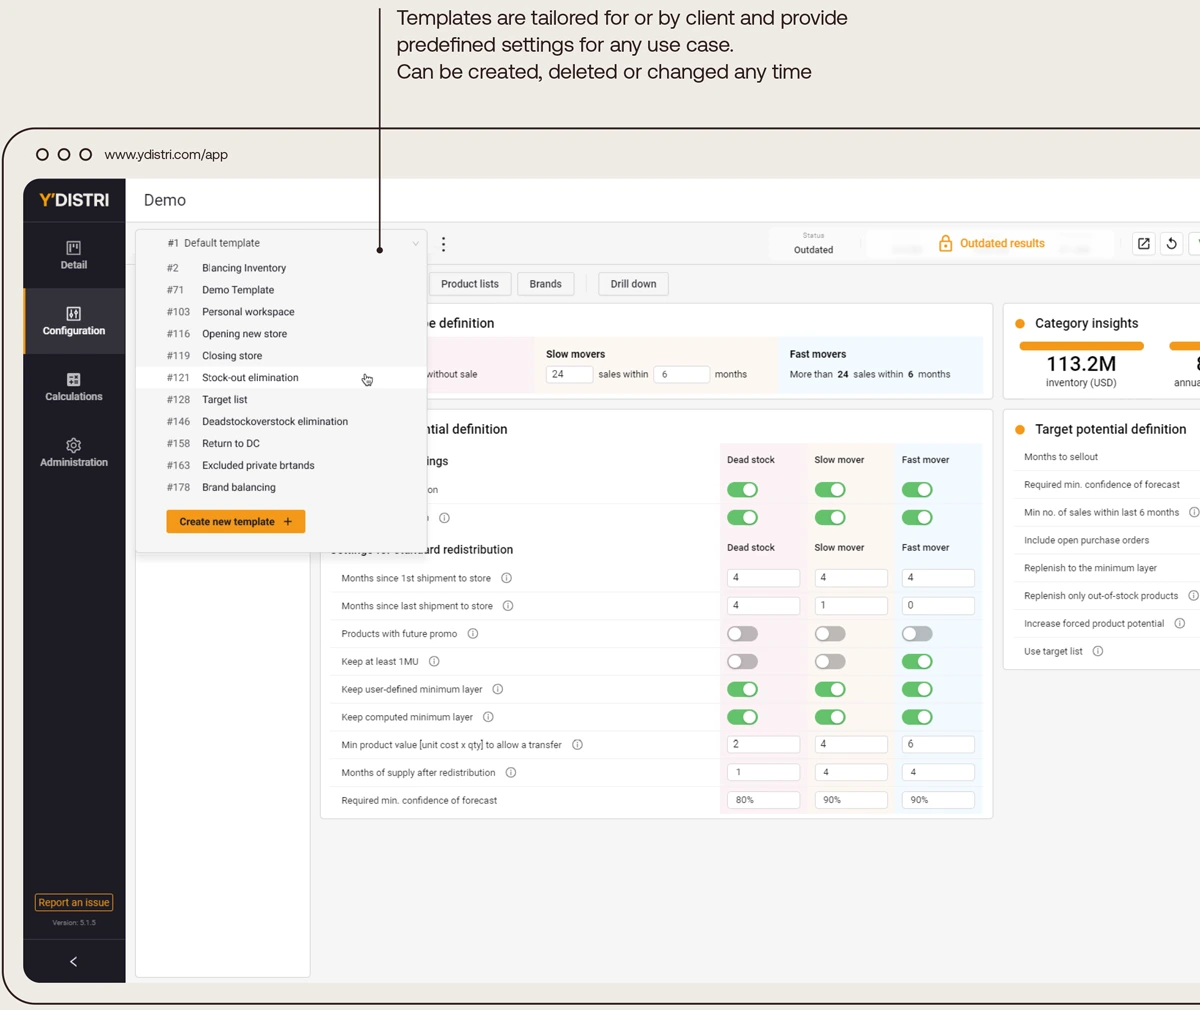
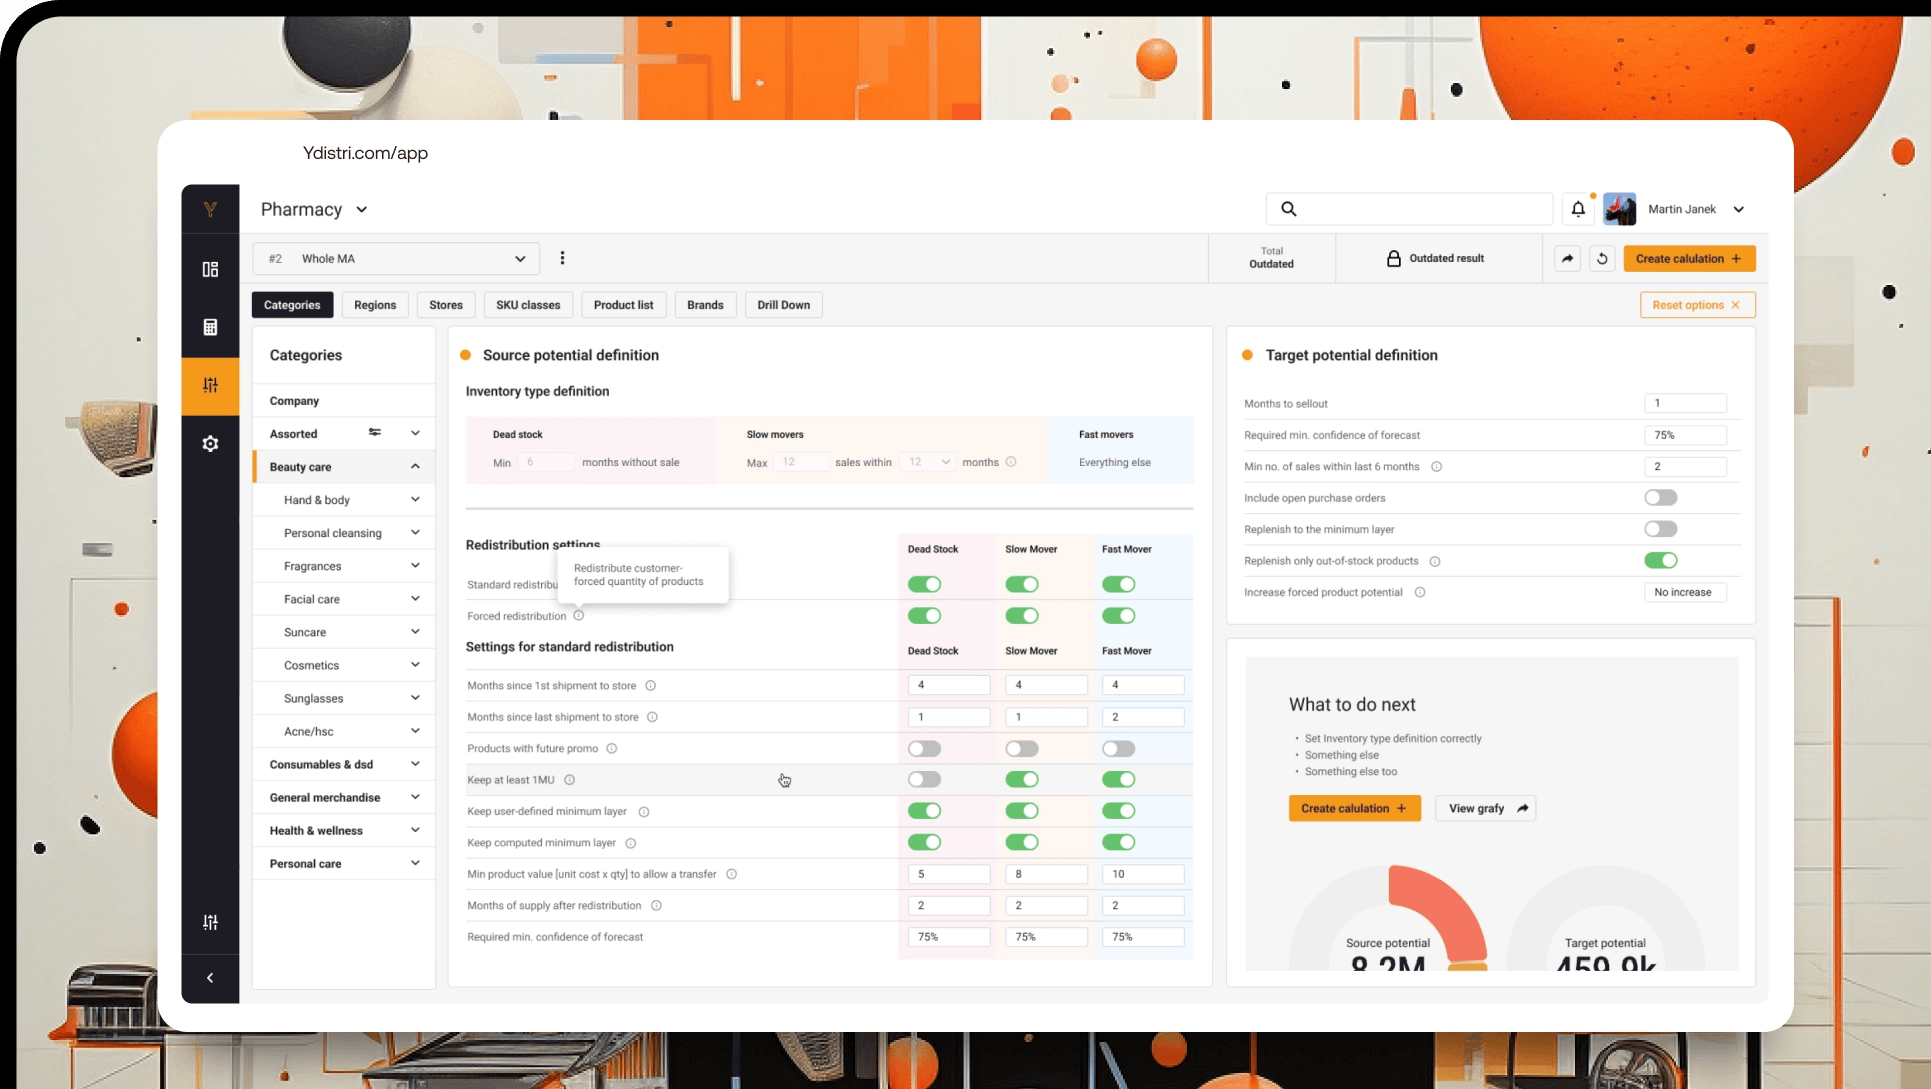
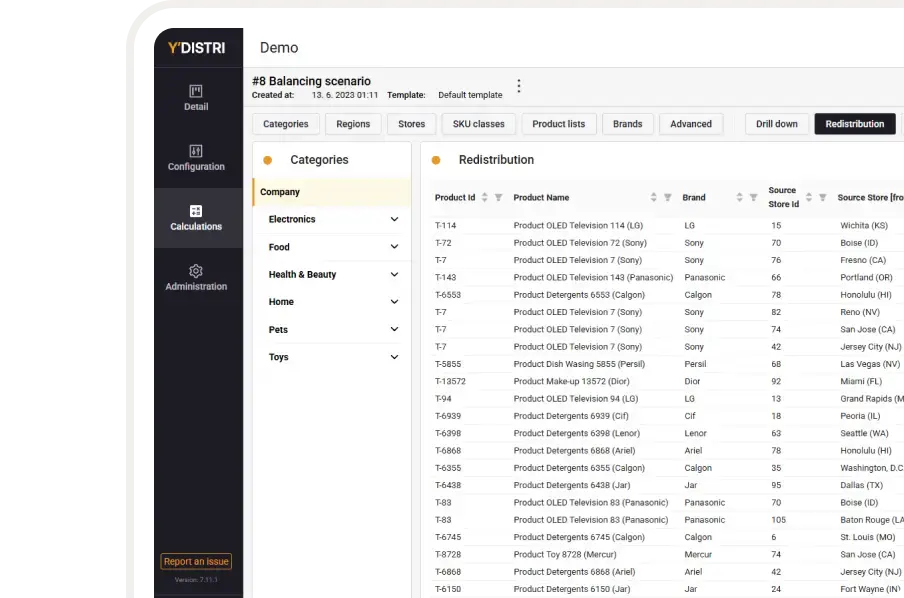
Safe testing simulations
Customers can model and configure various scenarios before settings redistribution parameters.
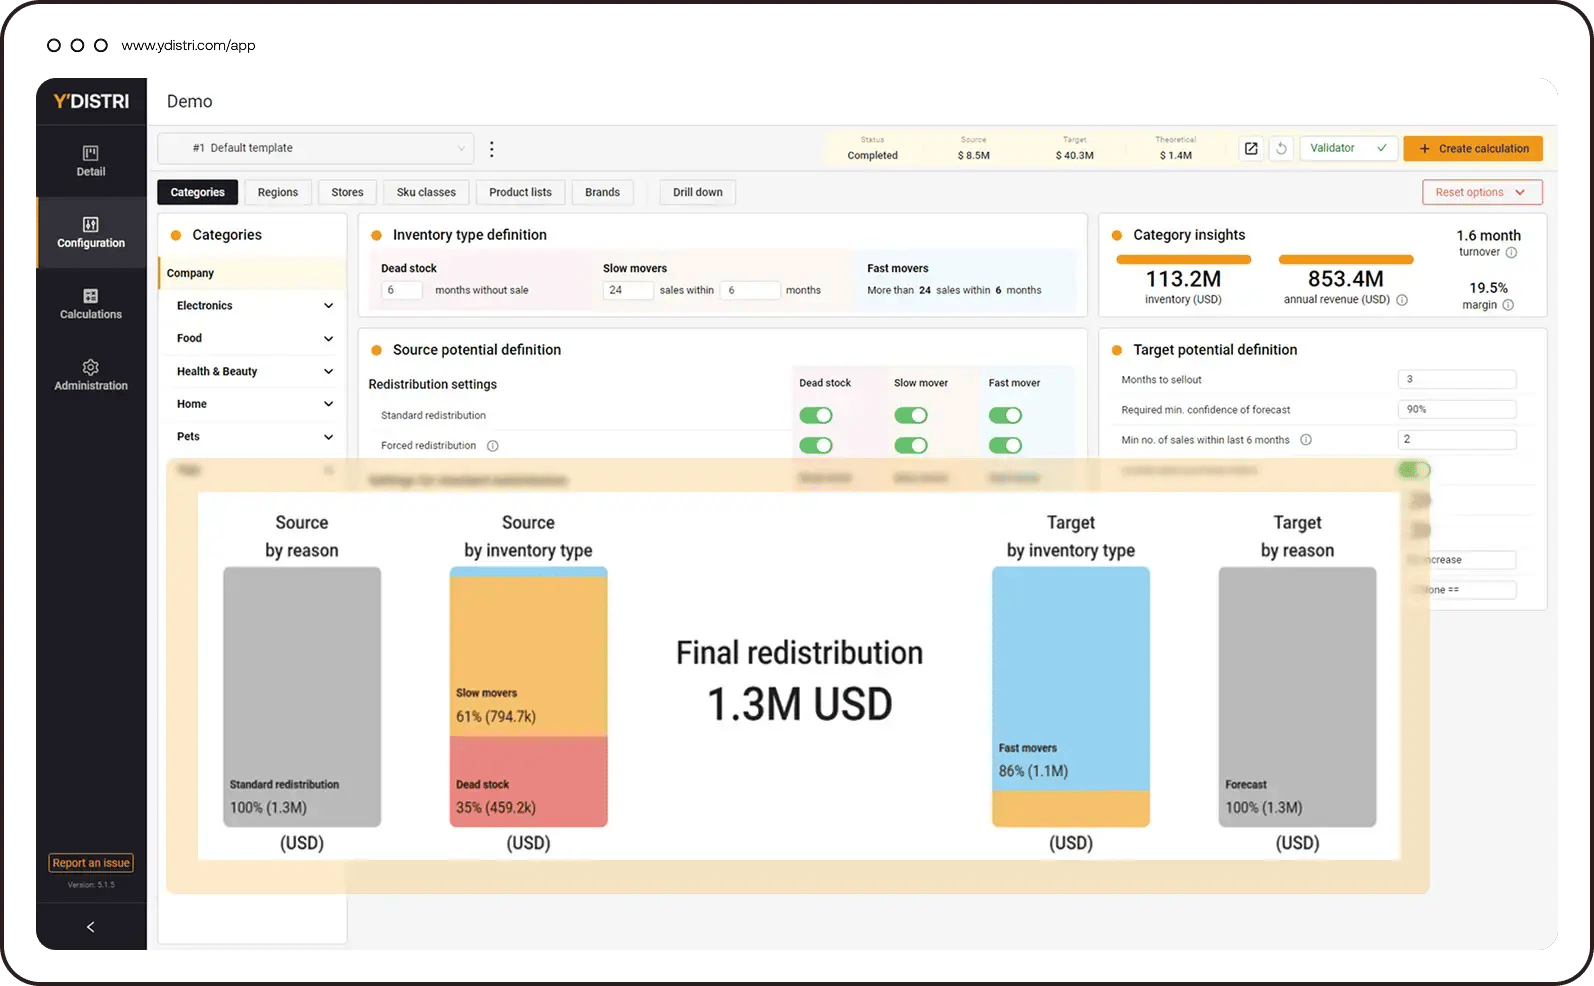
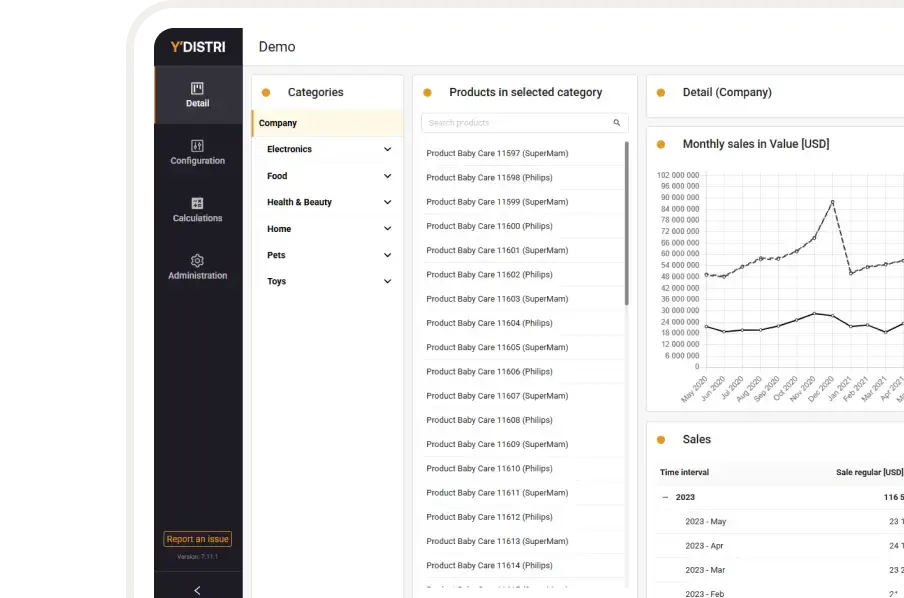
Simple visual workspaces
User-friendly interface provides a clear view of complex inventory structures and opportunities.
What
Our Clients Say.
Hear what our clients have to say about partnering with YDISTRI and the impact of AI-driven inventory optimization.
"The AI-driven redistribution really exceeded our expectations. Not only did we see a significant improvement in our P&L—especially in reducing our write-offs by 30%—but we also started using this tool to predict future write-offs with much greater accuracy."

CFO at Manor
"We are already seeing a positive impact on our P&L and balance sheet. I am convinced it has the potential to make a significant impact in larger markets as well, with scale being a crucial factor in the app’s efficacy."

General Manager
L´Occitane Central and Eastern Europe
"By store-to-store transfers retailers can turn over dead stock more than 10x quicker than using traditional selling methods."

Petcentrum